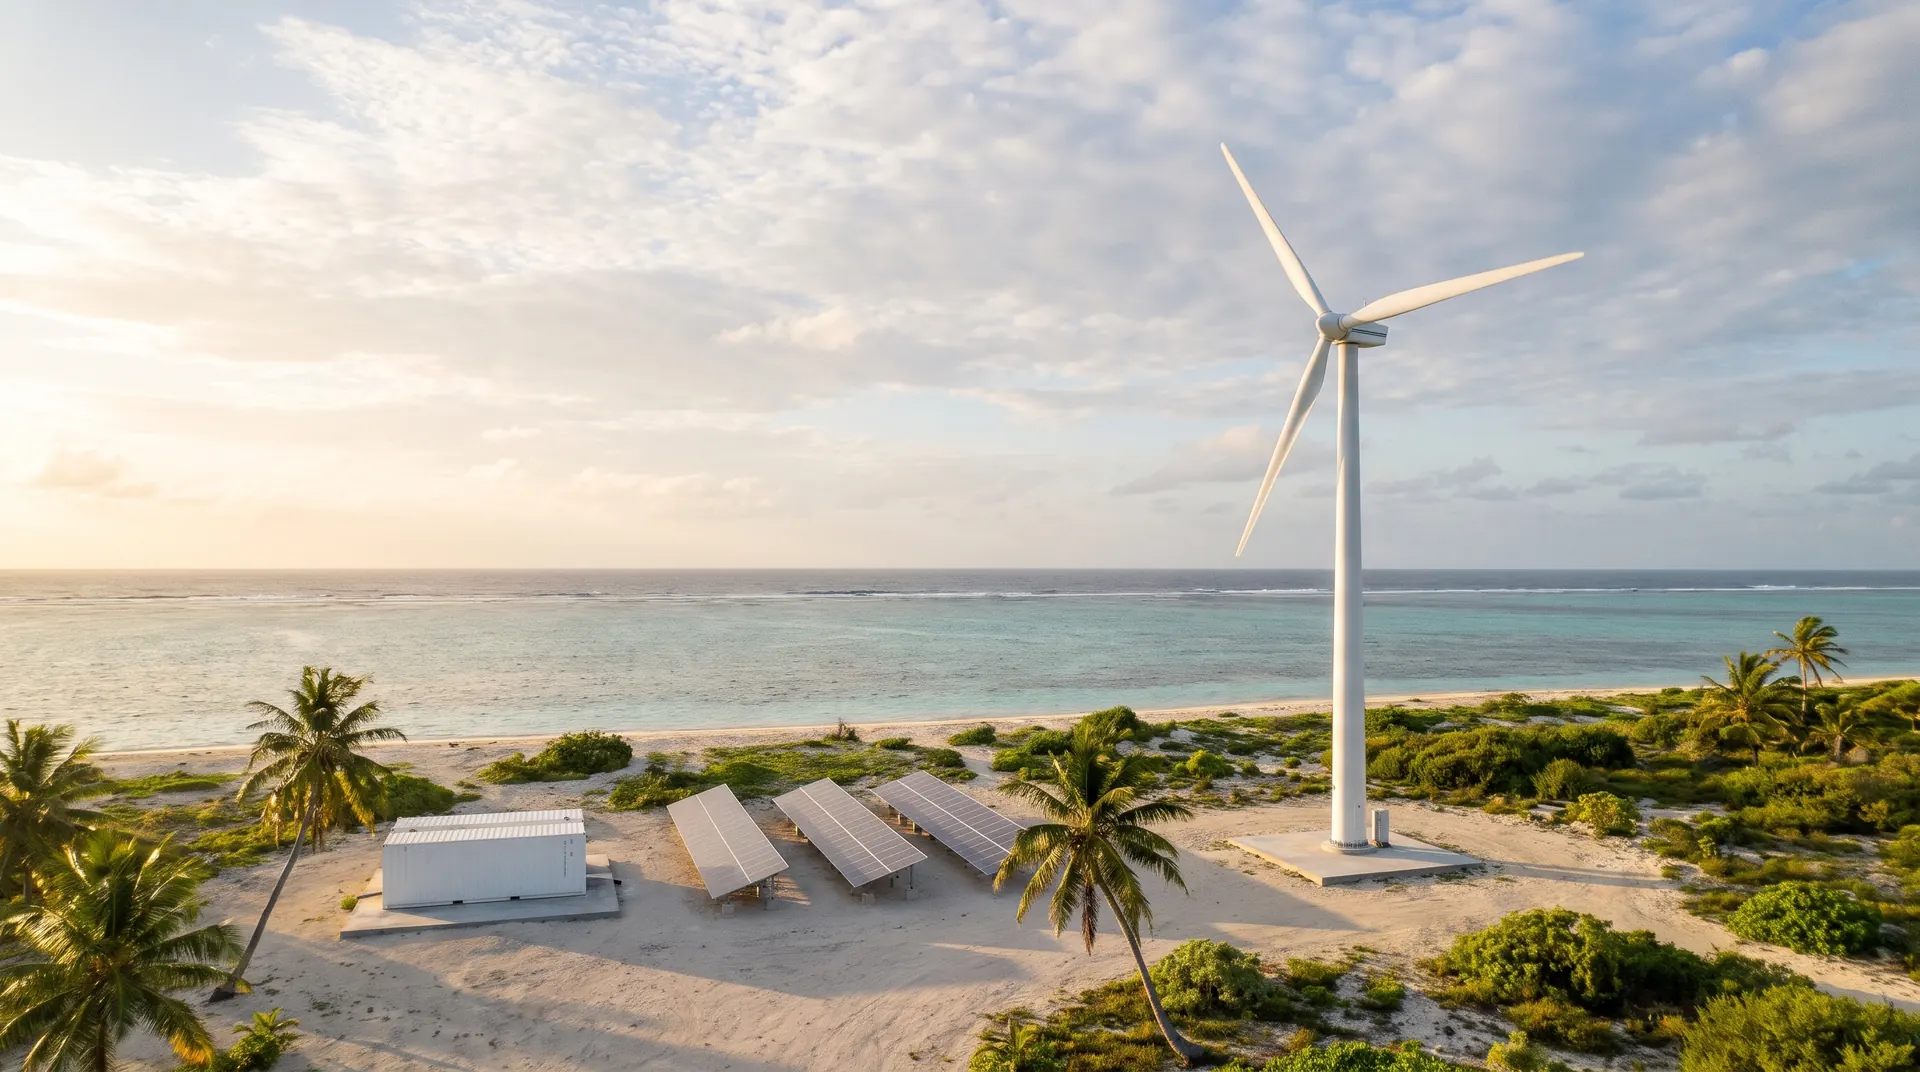
 Visualization
Wind power For islands, coasts and remote sites, with solar and storage.
We pair wind turbines with solar, batteries and your generator, so island and coastal sites run longer on their own power and burn less fuel.
- 1Wind turbine
- 2Solar array
- 3Battery storage
- 4Site controller
- 5Generator
- 6Your loads
Wind works when solar can’t.
Solar makes nothing after sunset. In our model of fourteen islands from the Caribbean to the Pacific, 46–59% of a small wind turbine’s output arrives while the sun is down.
Source and notesHide source and notes
Islands already run on wind and storage.
Islands pay the most for imported fuel. These grids, built by others, show what a well-engineered hybrid achieves.
- >99%
- Kodiak Island, Alaska: renewable share of supply, from hydro with 9 MW of wind and battery storage
- 60%
- Flinders Island, Australia: annual renewable share of up to 60%, from 900 kW of wind and 200 kW of solar with storage
- 45%
- Rottnest Island, Australia: renewable share over the year, and up to 95% at times, from 600 kW of wind and 600 kW of solar
Shown for context. Titanium did not build these plants.
What a site’s wind is worth.
A turbine’s output rises steeply with wind speed, so a site’s average wind decides its capacity factor. In 2023, one hundred US small wind projects averaged 13%. In our model, islands with a mean wind of 14.5 mph or more reach 37–67% before losses.
Source and notesHide source and notes
Measured before it is sold.
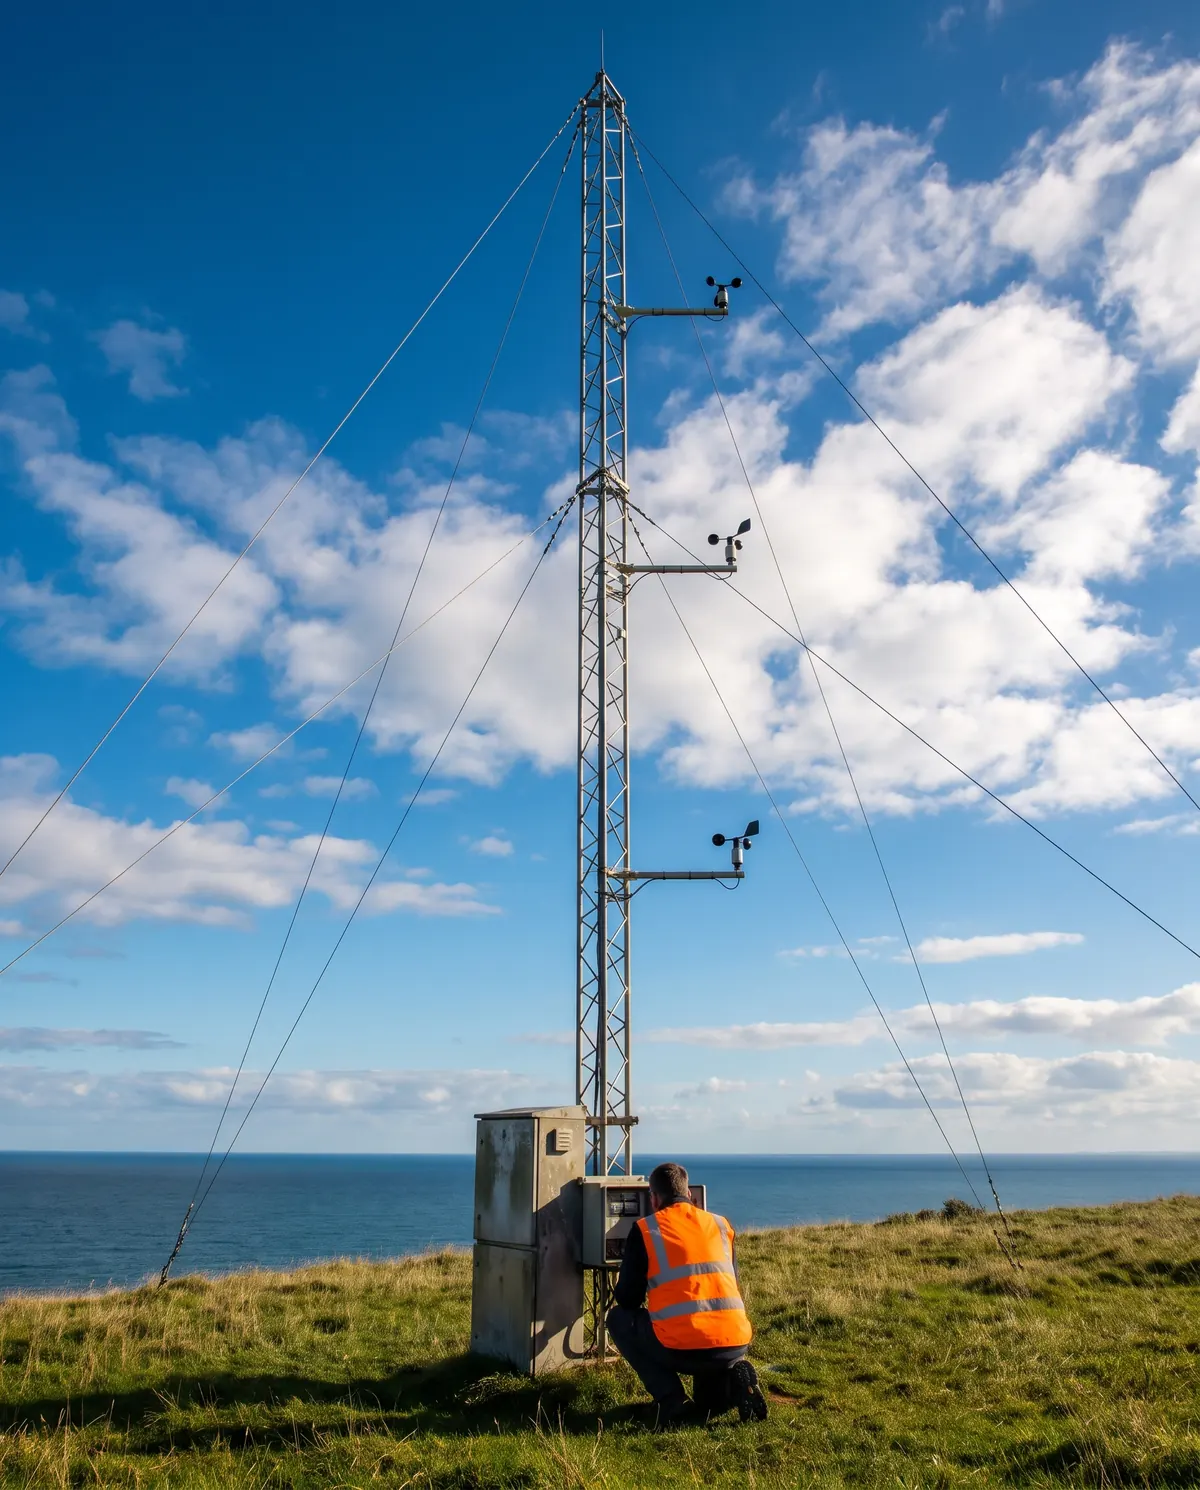
Wind changes from one stretch of shore to the next. Every project starts with long-term data for the site, and larger systems get a year of measurement before we fix the turbine and the tower.
of hours off Ambergris Caye, the trade wind blows from the east-northeast to the east-southeast (ERA5, 330 ft, 2015–2024). The turbine goes on the windward shore, clear of buildings and palms.
If more solar and battery would do the job for less, we will tell you.
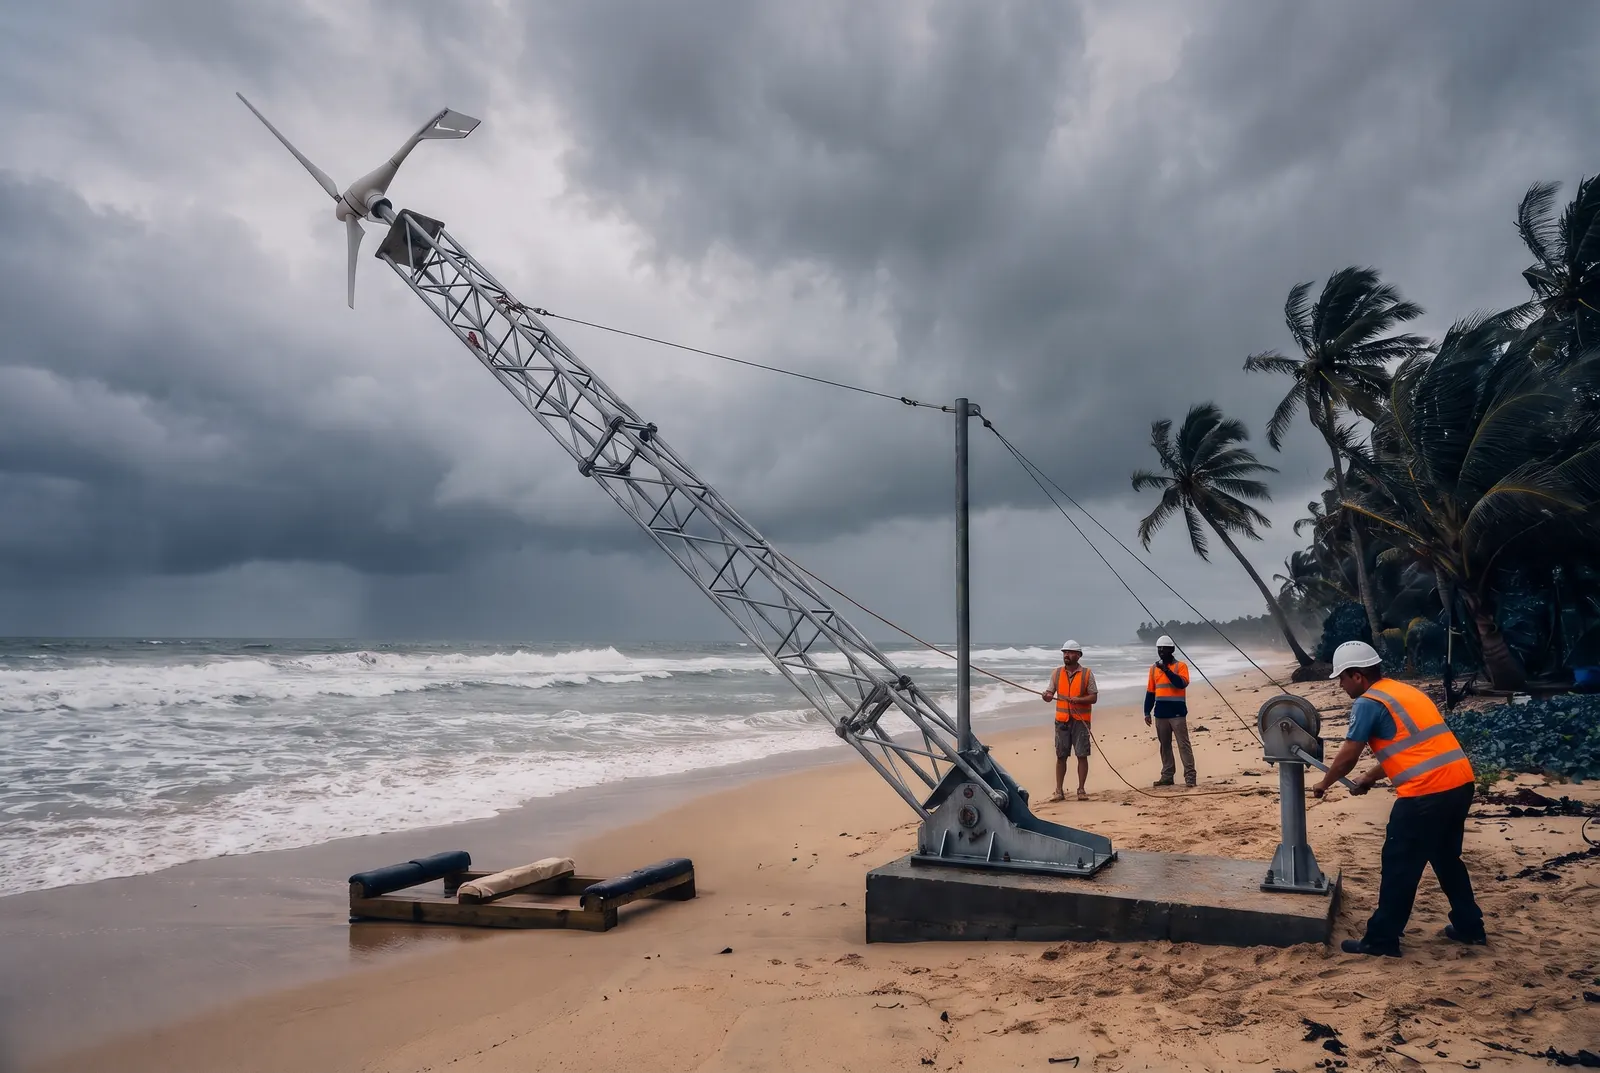
Designed for the storm, not the average day.
In 2003 Typhoon Maemi gusted to 166 mph and damaged every turbine at a coastal wind farm in Japan. In 2006 Typhoon Saomai caused 27 of 28 turbines at a wind farm in China to fail, five of them through tower collapse. On cyclone coasts, the wind class and the storm plan matter more than rated power. Certified small turbines are designed for extreme winds of 112–134 mph, and at least one island turbine is lowered to the ground and rated for 190 mph there.
- Class I
- 112 mph
- Class II
- 95 mph
- Class III
- 84 mph
Show 2 moreShow less
- Class T (tropical cyclones)
- 128 mph
- Class S
- Set by the designer for the site
Reference wind speed: a 10-minute average at hub height, set in the standard as 50, 42.5, 37.5 and 57 m/s. Classes I–III: IEC 61400-1 Ed. 3; Class T: IEC 61400-1 Ed. 4. Typhoon cases: Wind Energy Science 11, 2749 (2026). Extreme and survival winds: manufacturer data.
Any source, one controller.
Wind charges the battery after dark, solar carries the day, and the generator waits as the last backup. One controller runs them all, and our team watches it remotely.
Steady through gusts
Grid-forming battery inverters hold voltage and frequency while the wind rises and falls, so supply to lights and motors stays steady.
Generator last
When wind, sun and battery fall short, the generator starts, runs at its most efficient load and charges the battery as it runs.
Sized to the wind, and to the site.
Three classes of machine, from a single small turbine beside a caye home to island-scale plant.
- Small, up to 50 kW
- Caye homes, cottages, farms and telecom sites. Tilt-up towers can be lowered for maintenance and storms.
- Mid-size, 50–250 kW
- Resorts, island communities and agro-industry that run on generators today. Engineered foundations and crane access.
- Island-scale, 250 kW–1 MW
- Island grids and large estates. In cyclone regions, lowerable designs, or Class T machines where available.
From the first data to the storm plan.
We take a wind project from the desktop study to remote monitoring, working with turbine makers, who supply the machines, their certification and warranties. We engineer the plant around them and connect it to everything else on the site.
- 01
Desktop study
- Long-term wind data for the site
- First energy and fuel-saving estimate
- 02
Measure
- Met mast or lidar, up to a year
- Micro-siting on the windward shore
- 03
Feasibility
- Energy yield, cost and permits
- Turbine and tower for the wind class
- 04
Design and procure
- Foundations, crane and logistics plan
- Environmental, aviation and coastal permits
- 05
Install and commission
- Installation and testing
- Tie-in with solar, battery and generator
- 06
Operate
- Remote monitoring and maintenance
- Storm plan: stop, lower, secure, inspect
Risks, and how we design for them.
Six things that go wrong with wind on islands and coasts, and what we build in against each.
- Cyclones
- Turbine class and tower chosen for the site’s extreme wind, with a written plan to stop, lower and secure.
- Salt air
- Marine-grade coatings, sealed nacelles and stainless fasteners; inspections timed to the salt load.
- Noise
- Setbacks from guest rooms and homes, checked against the turbine’s published sound levels.
Show 3 moreShow less
- Birds and bats
- Sites screened for flyways and roosts in the environmental assessment.
- Aviation
- Tower height checked against nearby airstrips and flight paths.
- Logistics
- Barge, crane and access planned at feasibility, before a turbine is chosen.
What owners ask us.
Is my site windy enough?
The power in the wind rises with the cube of its speed, so the average at hub height decides almost everything. In our island data, trade-wind coasts averaged about 14.5–19.5 mph at a 98 ft hub. Our desktop study gives a first figure before you spend on measurement.
Does wind pay compared with more solar?
Not always. Per kWh, solar and batteries can cost less. Wind earns its place where it blows strongly after dark and fuel is costly to bring in. We model both and recommend the lower-cost mix.
What happens in a hurricane?
The turbine is stopped and, where the tower allows, lowered and secured before the storm. Its class, foundation and anchors are chosen for the site’s extreme wind, and everything is inspected before it restarts.
Can wind be added to my existing solar?
Usually, yes. Depending on your inverters, the turbine connects on the AC or the DC side, and the controller settings are updated so the battery and generator work with it.
Navigating Belize’s Energy Landscape
Belize’s energy rules are changing fast. Our engineers are fully licensed, and our established partnerships keep each project in step with every change, so our clients’ projects are delivered with ease.
PUC Licensed
Titanium Energy’s engineers are fully licensed by the Public Utilities Commission. Every system we build meets Belize’s grid and safety requirements as they stand today.
PUC Collaboration
We work directly with the PUC from feasibility studies to final interconnection approval, so each new rule is part of our clients’ projects from the start.
BTB Partnership
For resort and tourism projects, we coordinate closely with the Belize Tourism Board to align each installation with tourism development and national sustainability priorities.
Cross-Agency Coordination
Our working relationships with the energy ministry, the environment and lands departments and municipal authorities keep permits moving as the rules change.
“For foreign investors and developers, navigating Belize’s regulatory environment can be the biggest project risk. Our established relationships turn that risk into a managed process.”
 Jakob WoodruffCEO
Send us your site.
Five facts are enough for a first answer: whether wind suits your site, roughly what it could deliver, and what to measure next.
- 01Where the site is: a map pin is enough
- 02The open ground available and its distance to the shore
- 03Nearby buildings, trees and airstrips
- 04Your energy use and current generator
- 05Photos looking toward the prevailing wind