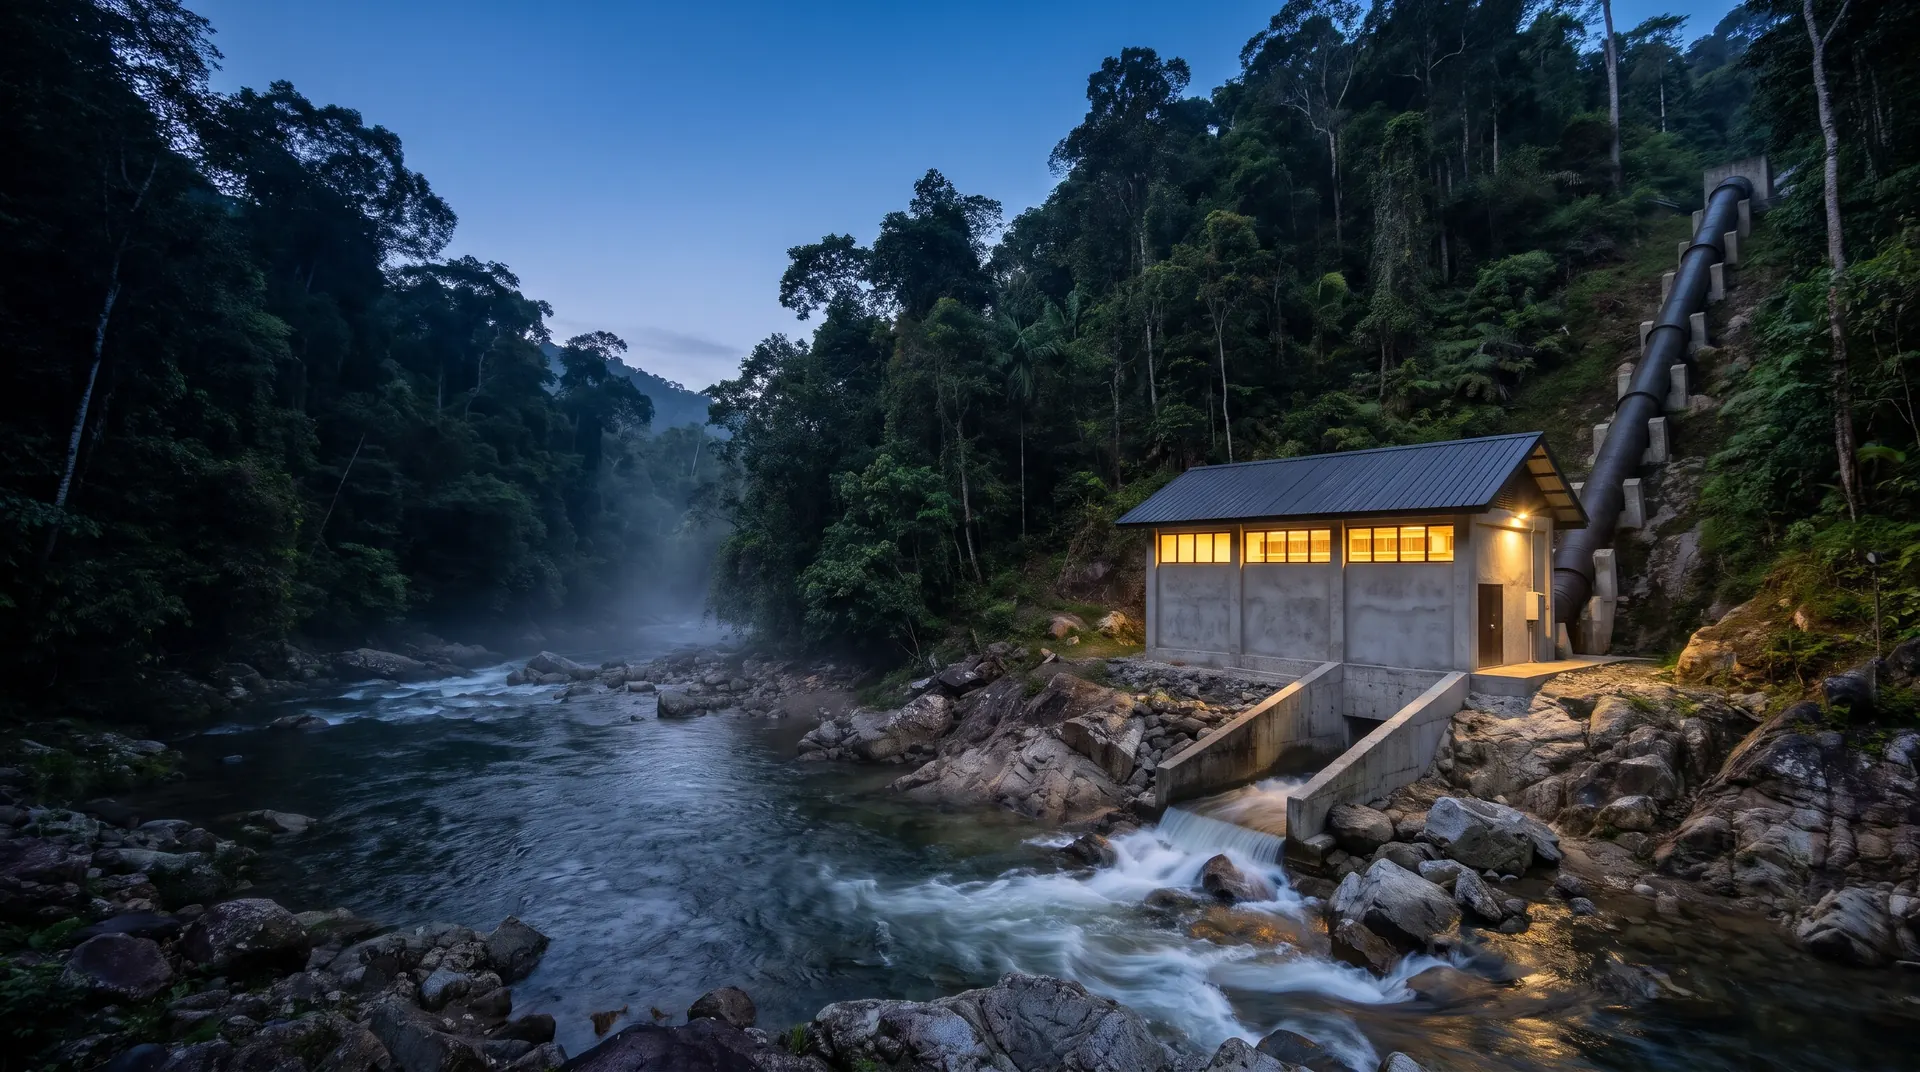
 Visualization
Hydro power Run-of-river plants, engineered with solar and storage.
We engineer run-of-river plants that turn the fall of a stream into steady power for estates, resorts, agro-industry and communities, and run them as one system with your solar, batteries and generator.
- 1Weir and intake
- 2Desilting basin
- 3Headrace and forebay
- 4Penstock
- 5Powerhouse
- 6Tailrace
The renewable that works all night.
A run-of-river plant produces day and night for as long as the stream flows, and its machines are built to run for decades.
- 52%
- Average capacity factor of new small hydro plants worldwide in 2024
- 40+years
- Design life of turbines and generators. Civil works last 50–100 years
- 1–6%
- Of the build cost each year to operate and maintain a small plant; 1–4% for hydro overall
Power is head times flow.
Head is the height the water falls. Flow is how much of it moves. Set both for your stream and see what a small plant could deliver.
- 6.2
- kW, day and night
- 149
- kWh a day
- 13
- gallons of diesel a day
An estimate, not a design: power (kW) = flow (US gal/min) × head (ft) × 55% ÷ 5,300. We assume 55% of the water’s power reaches the switchboard after pipe, turbine and generator losses, and 11.4 kWh a US gallon for a small diesel generator.
Size on the flow you can count on.
Rivers spend most of the year below their average. On one tropical river we analysed, the average flow is reached only 43% of the time, and the flow available 95% of the time is about a fifth of it.
Source and notesHide source and notes
Design flow
Chosen by weighing energy, cost and reliability across the whole flow duration curve, not taken from the average (ESHA). Off-grid sites weigh reliability most; grid-connected plants can take more energy in the wet months.
Reserved flow
Every plant leaves water in the stream below the intake: typically about 10% of the average flow, and 2.5–60% depending on the rules and the river (ESHA). We design to the stricter of the permit and the river’s needs.
Water and sun take turns.
In monsoon and tropical climates the wettest months are often the cloudiest and the driest the sunniest. In eight of the eleven regions we analysed, river flow and solar yield moved in opposite directions through the year; six are shown here. Built together, the two smooth each other’s seasonal swing, and a battery smooths the hours.
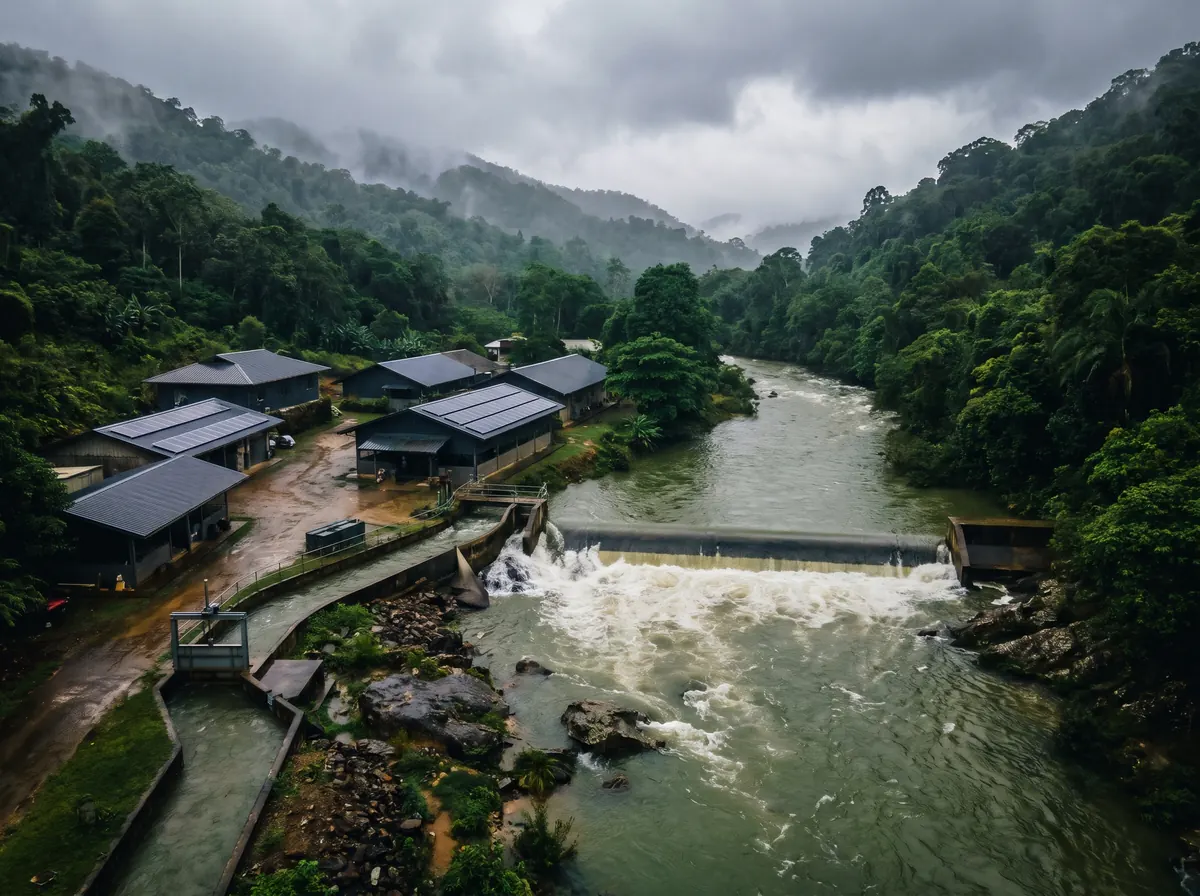
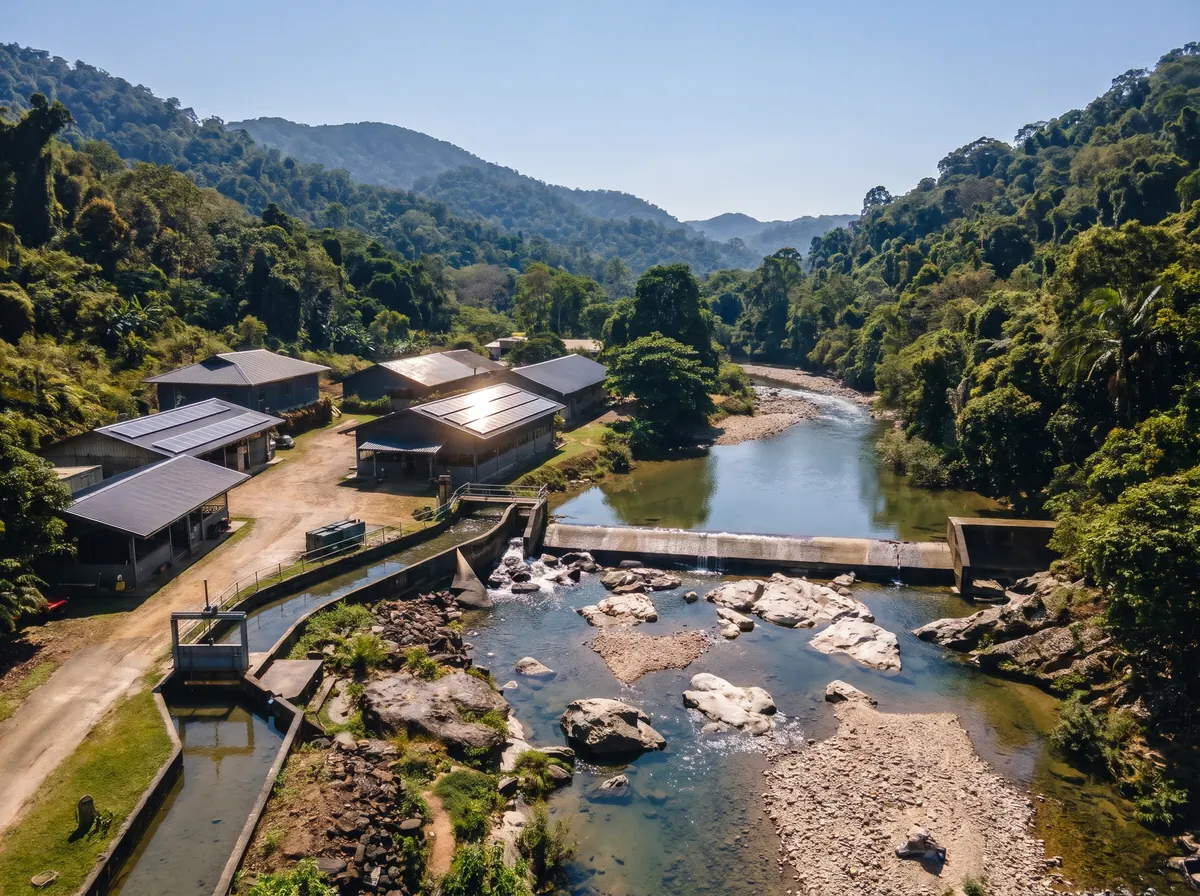
Source and notesHide source and notes
Any source, one controller.
Hydro carries the base load. Solar adds the daytime peak. The battery holds voltage and frequency and stores the surplus, and the generator waits as the last backup. One controller runs them all, and our team watches it remotely.
Nothing wasted
Surplus power charges the battery, then runs useful loads such as water heating, pumping, ice and cold rooms, instead of heating a ballast resistor.
A steadier plant
Grid-forming battery inverters take the fast changes, such as motor starts and load steps, so the turbine runs smoothly and the generator stays off.
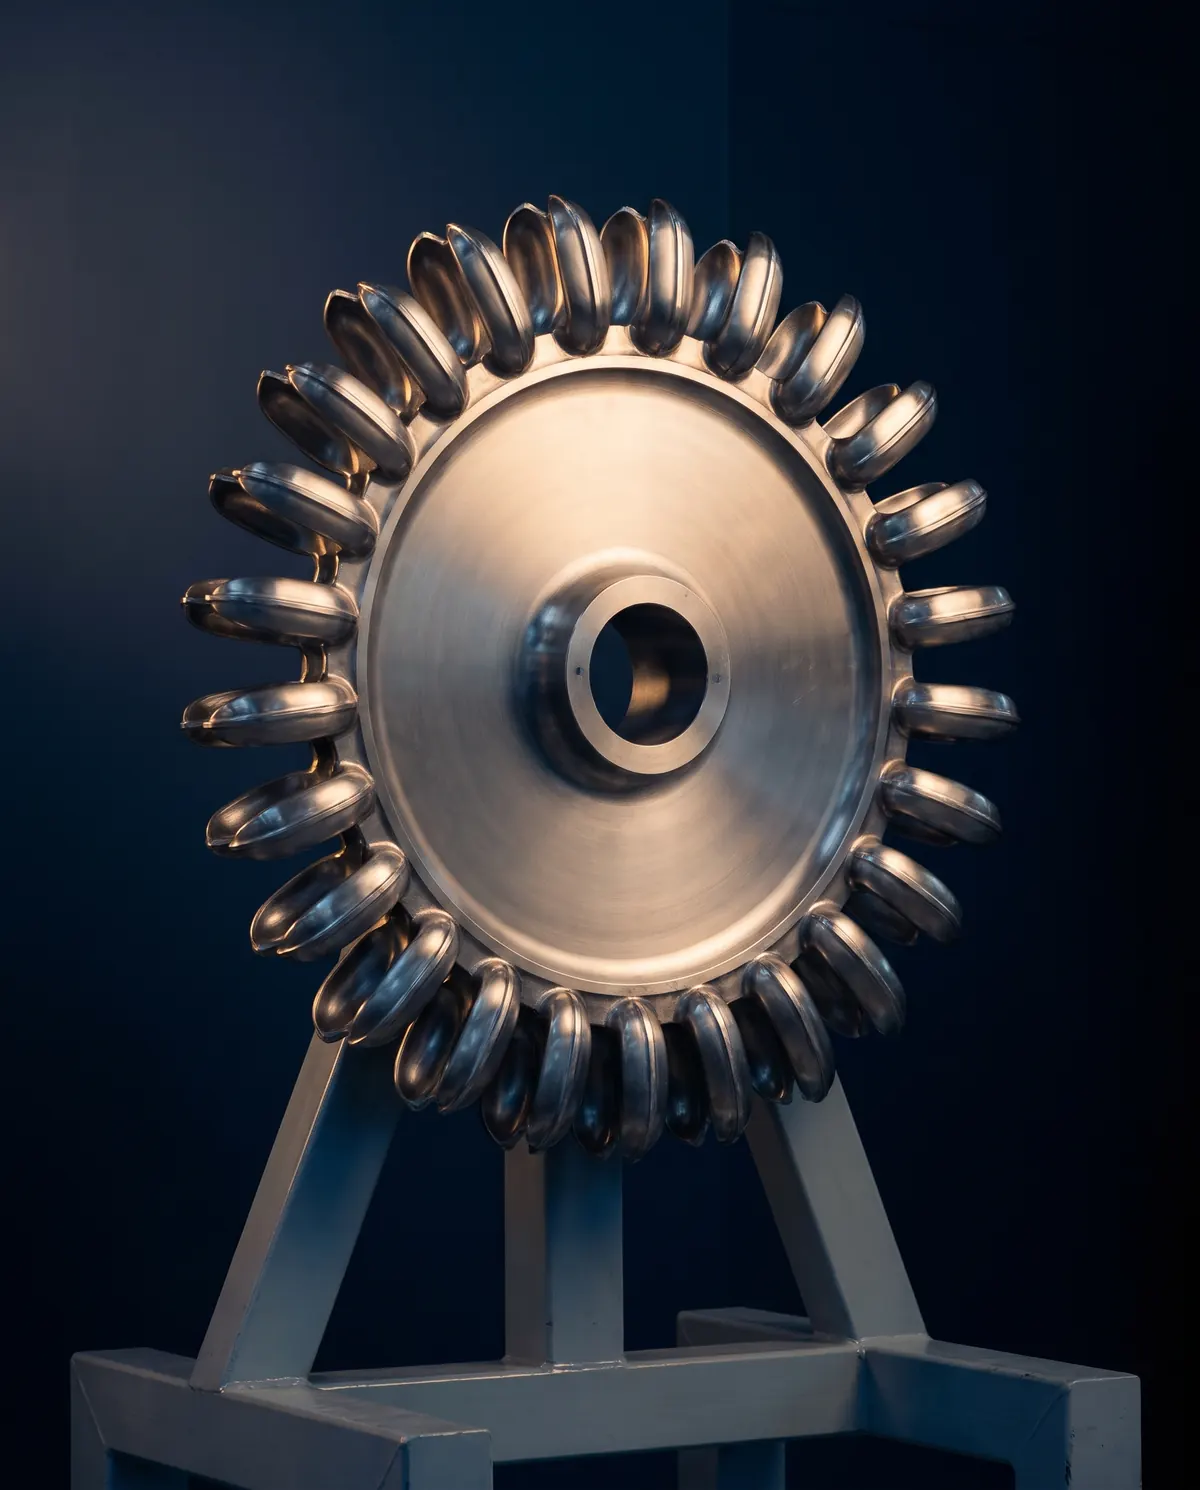
The right machine for the head.
High heads with small flows call for impulse turbines such as the Pelton and Turgo. Low heads with large flows call for reaction turbines such as the Francis and Kaplan. The choice also decides how well a plant copes when the stream drops.
- PeltonWater jets strike buckets on a wheel. High head, small flow.1654,250 ftBest efficiency90%Runs down to10%of rated flow
- TurgoAn impulse turbine for medium to high heads.165820 ftBest efficiency85%Runs down to20%of rated flow
- CrossflowA drum-shaped impulse runner, with lower peak efficiency than the others.16655 ftBest efficiencyLowerRuns down to—
- FrancisMedium head, steady flow. The highest peak efficiency in the table.801,150 ftBest efficiency94%Runs down to50%of rated flow
- KaplanLow head, large flow. Adjustable blades follow the flow.7130 ftBest efficiency93%Runs down to15%of rated flow
Source and notesHide source and notes
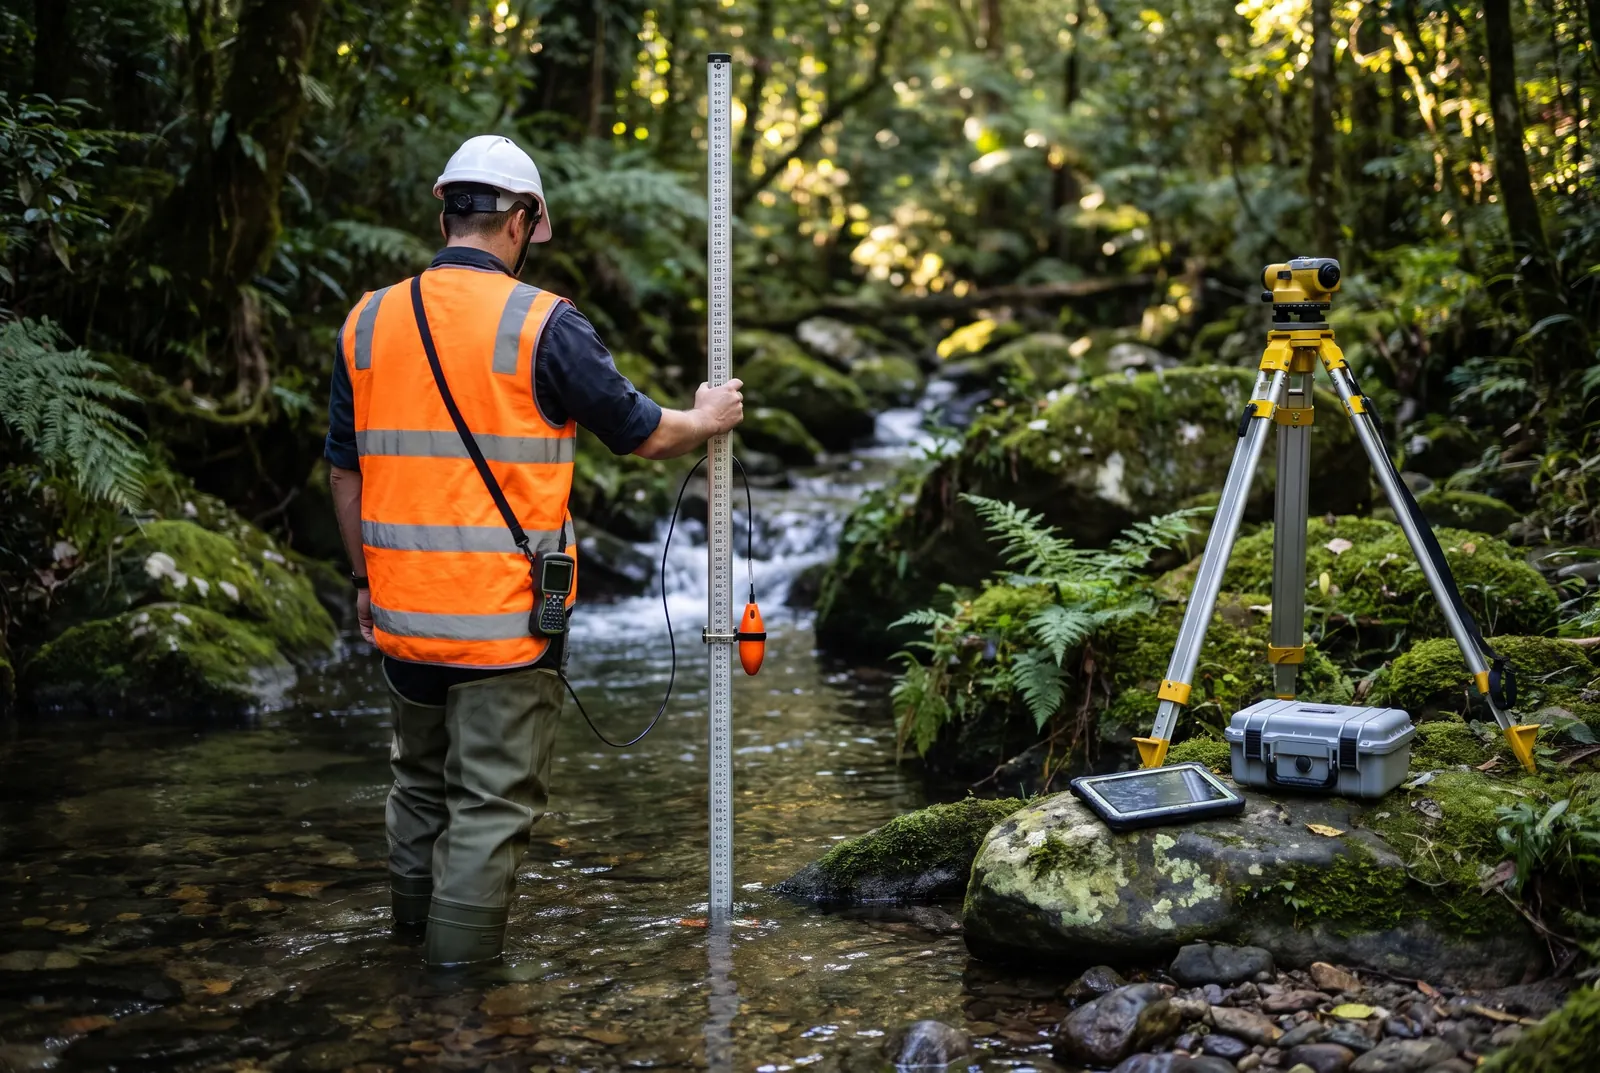
Water to wire, and beyond.
We take a plant from the first walk-over to remote monitoring, working with turbine and generator makers, who supply the machines and their performance guarantees. We engineer the plant around them and connect it to everything else on the site.
- 01
Walk-over
- Site visit and desktop study
- Survey of the head and pipe route
- 02
Measure
- Flow logged through a dry season
- Flow duration curve for the stream
- 03
Feasibility
- Design flow, energy and cost
- Permit path and land access
- 04
Design and permits
- Civil, hydraulic and electrical design
- Water licence and environmental permits
- Turbine, generator and controls
- 05
Build and commission
- Construction and installation
- Testing and commissioning
- Tie-in with solar, battery and generator
- 06
Operate
- Remote monitoring of flow and output
- Maintenance planned from the data
NotesHide notes
Equipment and acceptance tests are specified to the IEC standards for small hydro, including IEC 61116 (electromechanical equipment for small hydroelectric installations), IEC 62006 (acceptance tests of small hydroelectric installations), IEC 60193 (model acceptance tests) and IEC 60041 (field acceptance tests).
Risks, and how we design for them.
Five risks every small hydro plant faces, and what we build in against each.
- Floods
- Powerhouse and switchgear above the flood line; an intake with a spillway and stop logs, so the scheme can be shut and flushed.
- Silt and debris
- A trash rack and a desilting basin sized to the stream, with a flushing gate. Silt passing through a turbine erodes it.
- Dry years
- Design flow chosen from the measured flow duration curve, not the average. Solar and storage carry the shortfall.
Show 2 moreShow less
- River life
- A reserved flow left in the stream below the intake, and a screened intake.
- Permits and land
- Water licence, environmental clearance and land access settled before anything is built.
What owners ask us.
How much water does a plant need?
Head and flow work together. As a guide, 300 gallons a minute falling 100 feet gives about 3.1 kW, around 75 kWh a day, at 55% water-to-wire. A stream with less flow needs more head, and the other way round.
What happens in the dry season?
Flow drops, often to a fraction of the average. The design flow is set from the measured flow duration curve, and solar, which yields most in the dry months in much of the tropics, carries more of the load with the battery.
Can it connect to the utility grid?
Yes. A plant can export through the site’s connection under the local licence rules, with protection and synchronising designed to the utility’s requirements, or run as an island microgrid.
What does it cost to run?
Hydro plants typically cost 1–4% of their build cost a year to operate and maintain, and small plants up to about 6% (IRENA). The work is intake cleaning, bearings, seals and nozzles, and a check of the controls, planned from the monitoring data.
Navigating Belize’s Energy Landscape
Belize’s energy rules are changing fast. Our engineers are fully licensed, and our established partnerships keep each project in step with every change, so our clients’ projects are delivered with ease.
PUC Licensed
Titanium Energy’s engineers are fully licensed by the Public Utilities Commission. Every system we build meets Belize’s grid and safety requirements as they stand today.
PUC Collaboration
We work directly with the PUC from feasibility studies to final interconnection approval, so each new rule is part of our clients’ projects from the start.
BTB Partnership
For resort and tourism projects, we coordinate closely with the Belize Tourism Board to align each installation with tourism development and national sustainability priorities.
Cross-Agency Coordination
Our working relationships with the energy ministry, the environment and lands departments and municipal authorities keep permits moving as the rules change.
“For foreign investors and developers, navigating Belize’s regulatory environment can be the biggest project risk. Our established relationships turn that risk into a managed process.”
 Jakob WoodruffCEO
Send us your stream.
Five facts are enough for a first answer: whether hydro suits your site, roughly what it could deliver, and what to measure next.
- 01Where the site is
- 02The drop from where water could be taken to where power is used
- 03A rough flow, or a photo with the stream’s width and depth
- 04The distance to your loads
- 05Your energy use and current generator